Actually, this is very consistent with US voting history. If I recall correctly, Ed Tufte (Yale) did a historical analysis of election patterns and economics, back circa 1975, and showed that Dems do better in downturns and the GOP in rising economies.

Now, that’s more interesting.
LikeLike
can you link to underlying?
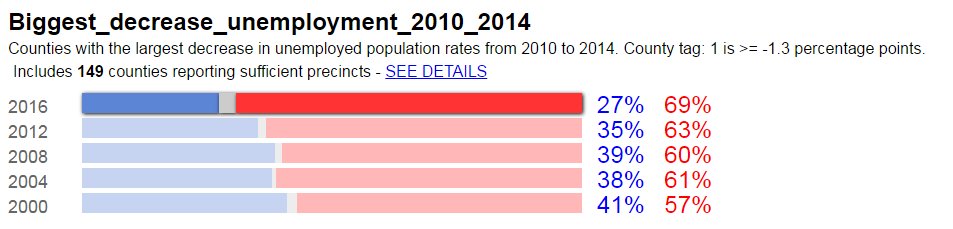
First thing that jumps out to me is only 149 out of 3,142 counties… so could be massively skewed.
Also doesn’t show methodology. Need to see underlying data
LikeLike
Could you give us a pointer to where this graph is from?
LikeLike
It’s in many reports all over the media. Here, for instance: http://www.usatoday.com/pages/interactives/how-the-election-unfolded/
LikeLike
Actually, this is very consistent with US voting history. If I recall correctly, Ed Tufte (Yale) did a historical analysis of election patterns and economics, back circa 1975, and showed that Dems do better in downturns and the GOP in rising economies.
LikeLike